Audit of global warming data finds it riddled with errors
Just ahead of a new report from the IPCC, dubbed SR#15 about to be released today, we have this bombshell- a detailed audit shows the surface temperature data is unfit for purpose. The first ever audit of the world’s most important temperature data set (HadCRUT4) has found it to be so riddled with errors and “freakishly improbable data” that it is effectively useless.
From the IPCC:
Global Warming of 1.5 °C, an IPCC special report on the impacts of global warming of 1.5 °C above pre-industrial levels and related global greenhouse gas emission pathways, in the context of strengthening the global response to the threat of climate change, sustainable development, and efforts to eradicate poverty.
This is what consensus science brings you – groupthink with no quality control.
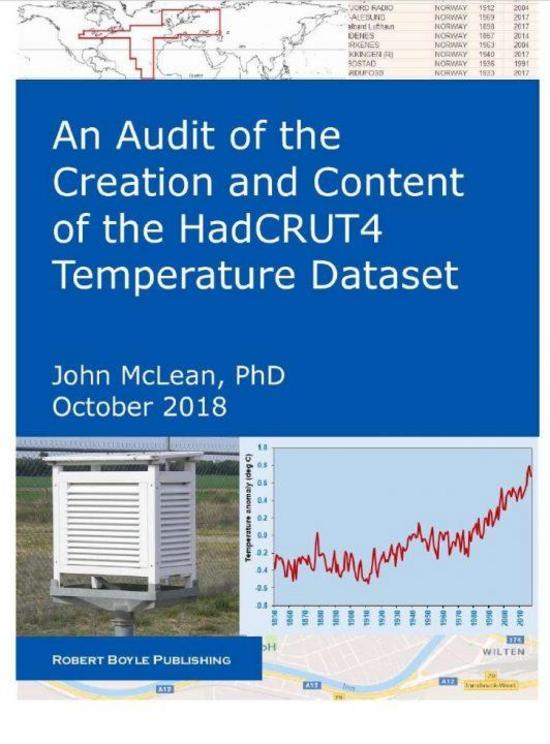
HadCRUT4 is the primary global temperature dataset used by the Intergovernmental Panel on Climate Change (IPCC) to make its dramatic claims about “man-made global warming”. It’s also the dataset at the center of “ClimateGate” from 2009, managed by the Climate Research Unit (CRU) at East Anglia University.
The audit finds more than 70 areas of concern about data quality and accuracy.
But according to an analysis by Australian researcher John McLean it’s far too sloppy to be taken seriously even by climate scientists, let alone a body as influential as the IPCC or by the governments of the world.
…
Main points:
- The Hadley data is one of the most cited, most important databases for climate modeling, and thus for policies involving billions of dollars.
- McLean found freakishly improbable data, and systematic adjustment errors , large gaps where there is no data, location errors, Fahrenheit temperatures reported as Celsius, and spelling errors.
- Almost no quality control checks have been done: outliers that are obvious mistakes have not been corrected – one town in Columbia spent three months in 1978 at an average daily temperature of over 80 degrees C. One town in Romania stepped out from summer in 1953 straight into a month of Spring at minus 46°C. These are supposedly “average” temperatures for a full month at a time. St Kitts, a Caribbean island, was recorded at 0°C for a whole month, and twice!
- Temperatures for the entire Southern Hemisphere in 1850 and for the next three years are calculated from just one site in Indonesia and some random ships.
- Sea surface temperatures represent 70% of the Earth’s surface, but some measurements come from ships which are logged at locations 100km inland. Others are in harbors which are hardly representative of the open ocean.
- When a thermometer is relocated to a new site, the adjustment assumes that the old site was always built up and “heated” by concrete and buildings. In reality, the artificial warming probably crept in slowly. By correcting for buildings that likely didn’t exist in 1880, old records are artificially cooled. Adjustments for a few site changes can create a whole century of artificial warming trends.
Details of the worst outliers
- For April, June and July of 1978 Apto Uto (Colombia, ID:800890) had an average monthly temperature of 81.5°C, 83.4°C and 83.4°C respectively.
- The monthly mean temperature in September 1953 at Paltinis, Romania is reported as -46.4 °C (in other years the September average was about 11.5°C).
- At Golden Rock Airport, on the island of St Kitts in the Caribbean, mean monthly temperatures for December in 1981 and 1984 are reported as 0.0°C. But from 1971 to 1990 the average in all the other years was 26.0°C.
More at Jo Nova
The report:
Unfortunately, the report is paywalled. The good news is that it’s a mere $8.
The researcher, John McLean, did all the work on his own, so it is a way to get compensated for all the time and effort put into it. He writes:
This report is based on a thesis for my PhD, which was awarded in December 2017 by James Cook University, Townsville, Australia. The thesis1 was based on the HadCRUT4 dataset and associated files as they were in late January 2016. The thesis identified 27 issues of concern about the dataset.
The January 2018 versions of the files contained not just updates for the intervening 24 months, but also additional observation stations and consequent changes in the monthly global average temperature anomaly right back to the start of data in 1850.
The report uses January 2018 data and revises and extends the analysis performed in the original thesis, sometimes omitting minor issues, sometimes splitting major issues and sometimes analysing new areas and reporting on those findings.
The thesis was examined by experts external to the university, revised in accordance with their comments and then accepted by the university. This process was at least equivalent to “peer review” as conducted by scientific journals.
I’ve purchased a copy, and I’ve reproduced the executive summary below. I urge readers to buy a copy and support this work.
Get it at source link below.
For the rest of this article please go to source link below.