A history of climate fraud
Much of the below analysis is courtesy of Kenneth Richard.
The combined Hadley Centre and Climatic Research Unit (HadCRUT) data set –which is featured in IPCC reports– underwent a revision from version 3 to version 4 in March of 2012, about a year before the next IPCC report was due.
At the time (early 2012), the HadCRUT3 was showing a slight global cooling trend between 1998 and 2012, visible in the graph below which uses HadCRUT3 and HadCRUT4 raw data. In conjunction with changing versions, the slight cooling trend had conveniently changed to a slight warming trend:
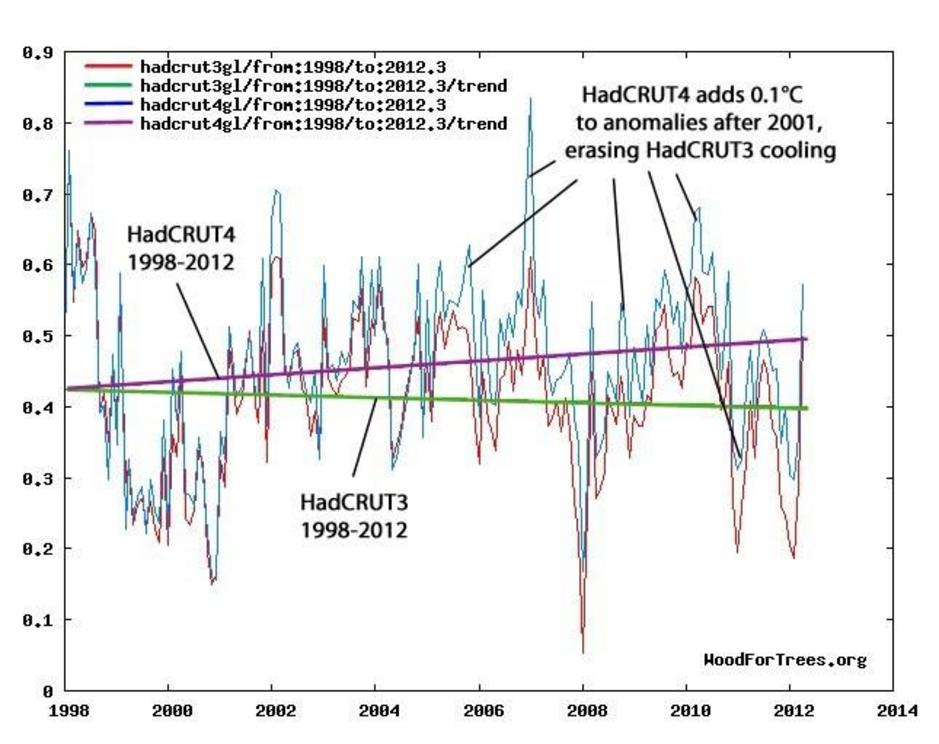
Source: WoodForTrees.
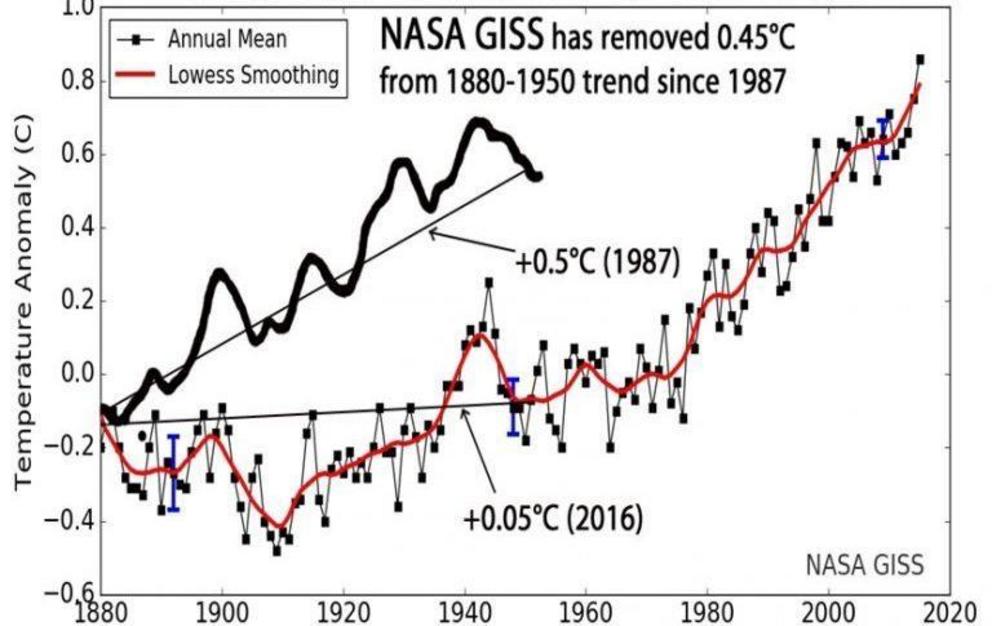
As recently as 1990, it was widely accepted that the global temperature trend showed a “0.5°C rise between 1880 and 1950”, as reported by NASA (Hansen and Lebedeff, 1987). This rise (as well as the 0.6C rise between 1880 and 1940) can clearly be seen in the NASA GISS graph from 1987:
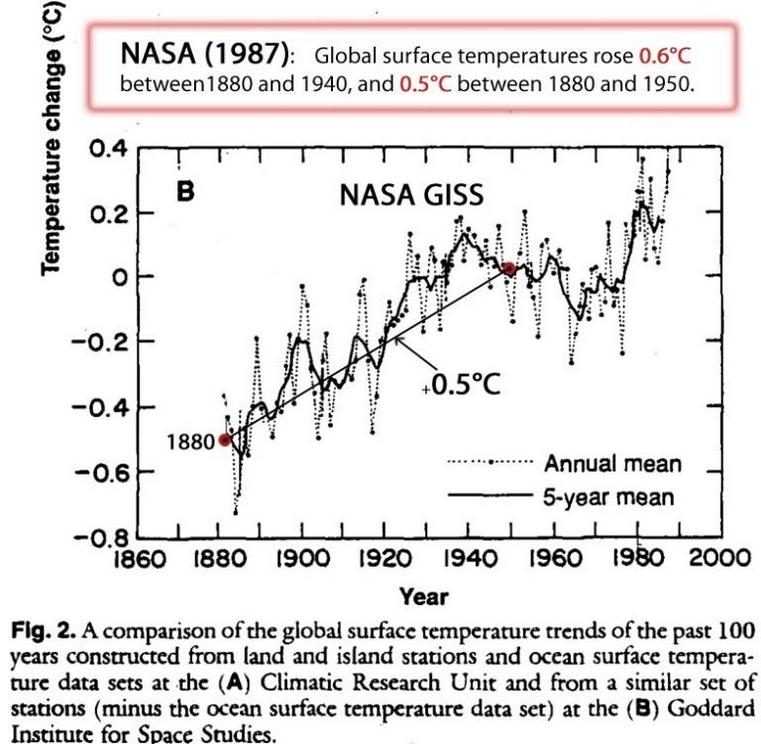
Today, it is no longer acceptable for NASA to depict such a strong warming trend between 1880 and 1950 because CO2 emissions during that period were flat/negligible compared to today’s.
NASA needed to minimize this inconvenient 0.5C non-anthropogenic warming trend, and, in typically brazen fashion, they simply made a new graph which all-but eradicated it (to just 0.05C):
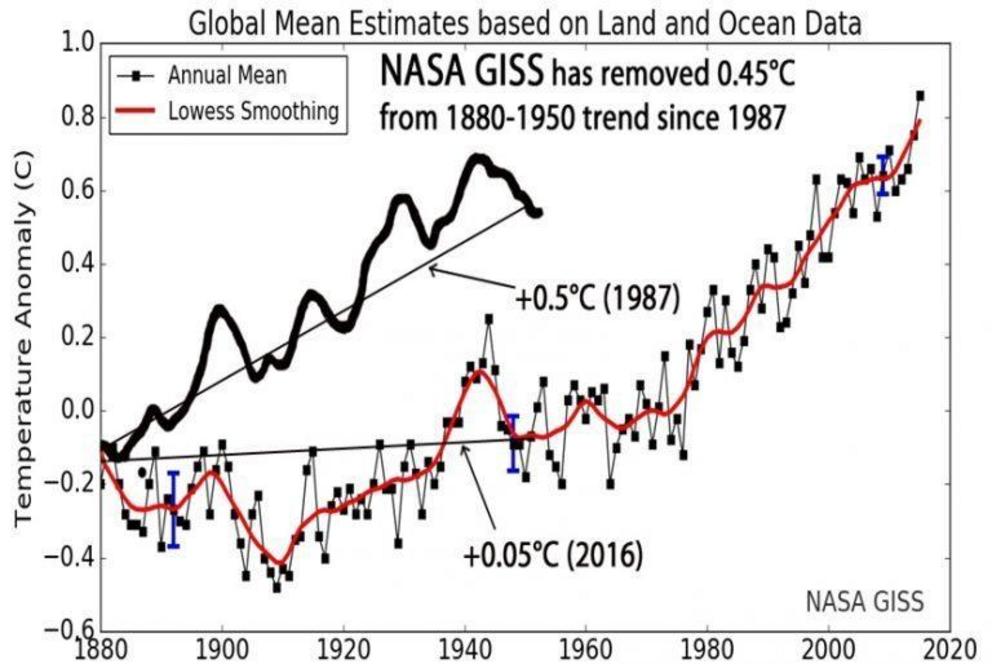
NASA GISS
This is a warping of the data to support an agenda.
This is fraud.
Cooling the past exaggerates the modern warming trend.
But issues for NASA remain: proving more difficult is ‘adjusting’ the pesky cooling trend from 1945 to 1980–while atmospheric CO2 levels were rising exponentially. Perhaps there are too many modern data sets and proxy records to tamper with? Or maybe that was an added benefit to minimizing the 1880-1950 trend–the ’45 to ’80 cooling doesn’t appear anywhere near as pronounced as it actually was.
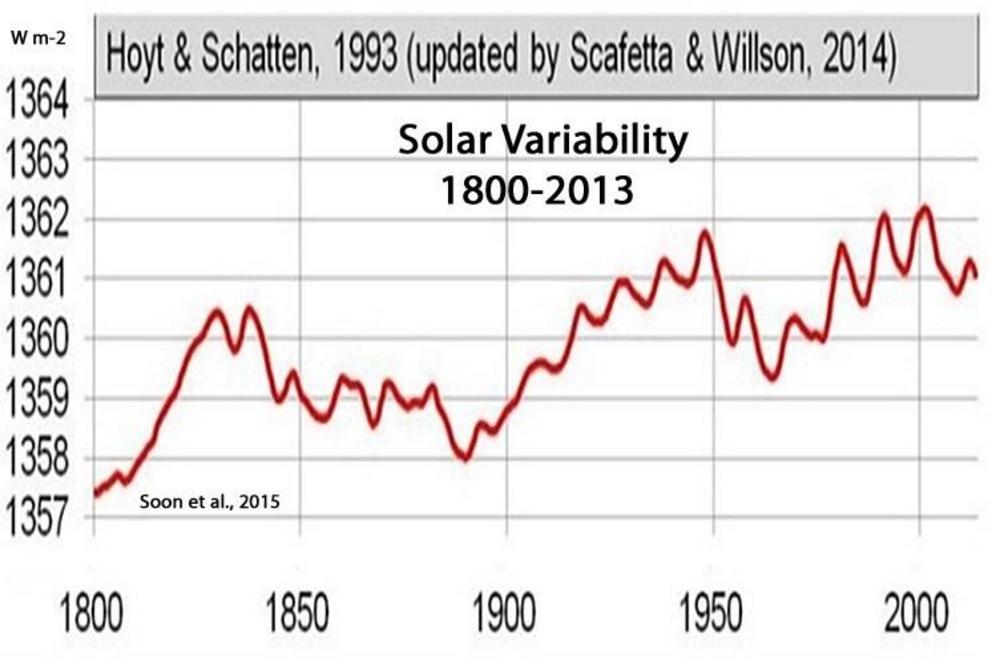
What’s more, after removing instrumental ‘adjustments’ and urban bias, global temperatures appear to closely follow solar activity:
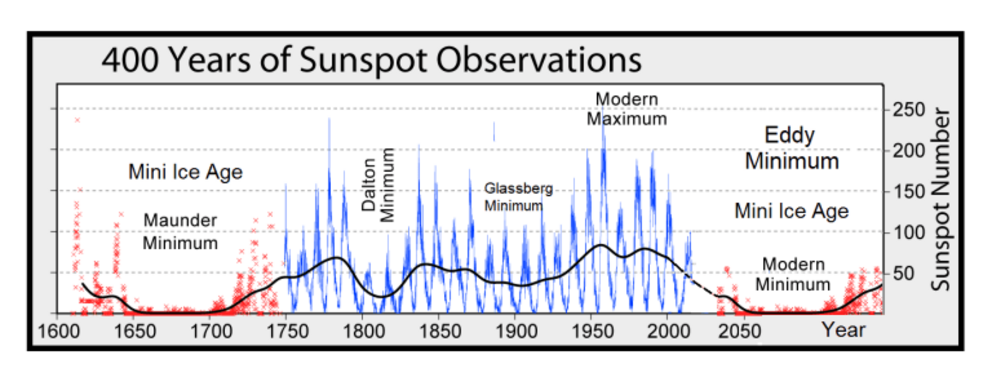
I’m sick of the lies — lies made a thousands times worse by the climatic reality that is actually fast-barreling towards us: the COLD TIMES are returning, the mid-latitudes are REFREEZING, in line with historically low solar activity, cloud-nucleating Cosmic Rays, and a meridional jet stream flow.
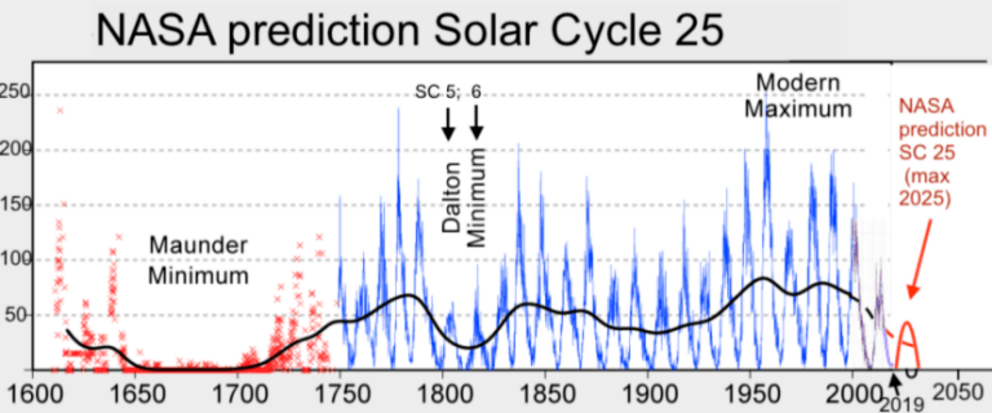
Both NOAA and NASA appear to agree, if you read between the lines, with NOAA saying we’re entering a ‘full-blown’ Grand Solar Minimum in the late-2020s, and NASA seeing this upcoming solar cycle (25) as “the weakest of the past 200 years”, with the agency correlating previous solar shutdowns to prolonged periods of global cooling here.
Furthermore, we can’t ignore the slew of new scientific papers stating the immense impact The Beaufort Gyre could have on the Gulf Stream, and so the climate overall.
Prepare for the COLD— learn the facts, relocate if need be, and grow your own.
Social Media channels are restricting Electroverse’s reach: Twitter are purging followers while Facebook are labeling posts as “false” and have slapped-on crippling “page restrictions”:

Be sure to subscribe to receive new post notifications by email (the box is located in the sidebar >>> or scroll down if on mobile).
And/or become a Patron, by clicking here: patreon.com/join/electroverse, and/or consider “allowing ads” for www.electroverse.net if you use a blocker.
The site receives ZERO funding, and never has. So any way you can, help us spread the message so others can survive and thrive in the coming times.
Grand Solar Minimum + Pole Shift